Think of security prices as the result of a head-to-head battle between a bull (the buyer) and a bear (the seller). The bulls push prices higher and the bears push prices lower. The direction prices actually move reveals who is winning the battle.
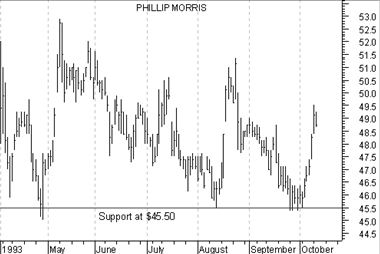
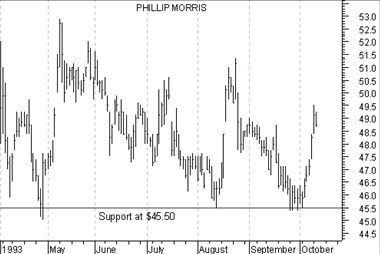
Using this analogy, consider the price action of Phillip Morris in Figure 6. During the period shown, note how each time prices fell to the $45.50 level, the bulls (i.e., the buyers) took control and prevented prices from falling further. That means that at the price of $45.50, buyers felt that investing in Phillip Morris was worthwhile (and sellers were not willing to sell for less than $45.50). This type of price action is referred to as support, because buyers are supporting the price of $45.50.

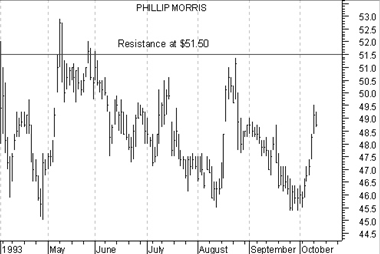
Similar to support, a "resistance" level is the point at which sellers take control of prices and prevent them from rising higher. Consider Figure 7. Note how each time prices neared the level of $51.50, sellers outnumbered buyers and prevented the price from rising.

The price at which a trade takes place is the price at which a bull and bear agree to do business. It represents the consensus of their expectations. The bulls think prices will move higher and the bears think prices will move lower.
Support levels indicate the price where the majority of investors believe that prices will move higher, and resistance levels indicate the price at which a majority of investors feel prices will move lower.
But investor expectations change with time! For a long time investors did not expect the Dow Industrials to rise above 1,000 (as shown by the heavy resistance at 1,000 in Figure 8). Yet only a few years later, investors were willing to trade with the Dow near 2,500.

The term "technical analysis" is a complicated sounding name for a very basic approach to investing. Simply put, technical analysis is the study of prices, with charts being the primary tool. The roots of modern-day technical analysis stem from the Dow Theory, developed around 1900 by Charles Dow. Stemming either directly or indirectly from the Dow Theory, these roots include such principles as the trending nature of prices, prices discounting all known information, confirmation and divergence, volume mirroring changes in price, and support/resistance. And of course, the widely followed Dow Jones Industrial Average is a direct offspring of the Dow Theory. Charles Dow's contribution to modern-day technical analysis cannot be understated. His focus on the basics of security price movement gave rise to a completely new method of analyzing the markets.
When a resistance level is successfully penetrated, that level becomes a support level. Similarly, when a support level is successfully penetrated, that level becomes a resistance level.
An example of resistance changing to support is shown in Figure 17. When prices broke above the resistance level of $45.00, the level of $45.00 became the new support level.
His is because a new "generation" of bulls who didn't buy when prices were less than $45 (they didn't have bullish expectations then) are now anxious to buy anytime prices return near the $45 level.